| StockFetcher Forums · General Discussion · XIV | << 1 ... 9 10 11 12 13 ... 22 >>Post Follow-up |
| olathegolf 119 posts msg #141217 - Ignore olathegolf |
1/20/2018 11:38:05 PM Davesaint86, the DMA shown on the charts are off (long triggers, short triggers, and DMA/MA crossovers). Easiest way to see this is to run your filter. Then click on XIV to see the chart. Have the chart on one screen and the filter on another. Below the filter click on the date offset to back up one day at a time. When you see the long/short trigger on your table change from positive to negative or negative to positive, note the day of the change and see if it matches the chart. SF is saying that they won't match. If you simply printed the chart and gave it to someone, it would look like gold. The reality is that accurate displacement can only happen after those bars have been printed - and DMA can't see into the future. So, as a result, the DMA triggers shown on the chart are earlier than you'd actually see them when you run the current filter. Looking through the last 11 pages of this thread, you can see that many people are noticing this. Still great filters, don't get me wrong. I was initially lulled into thinking that the chart and table matched - and looking at the chart allowed me a quick way to visually backtest the system. Seeing the crossovers and long/short triggers is very visual. Problem is that they may not be entirely accurate if you use DMA. |
| Mactheriverrat 3,173 posts msg #141218 - Ignore Mactheriverrat modified |
1/21/2018 12:10:34 AM Ok But people can use the 40 filters system to pick 1 frigging stock I will take 10% any day. 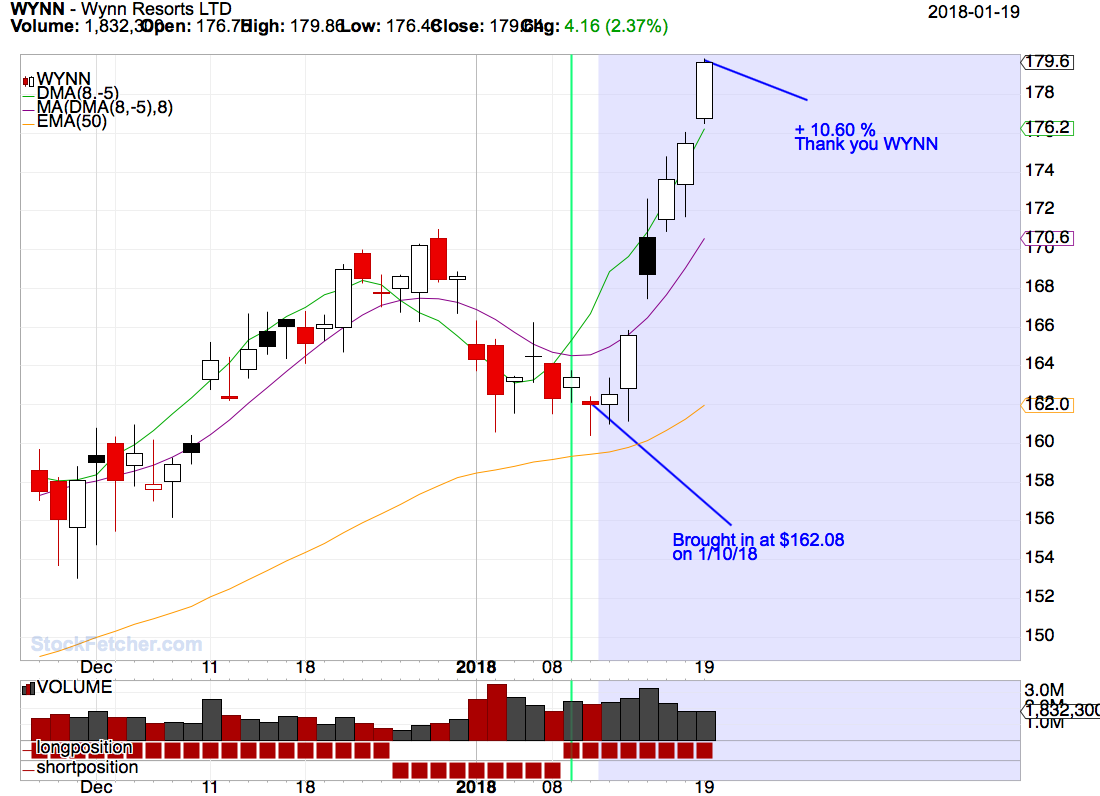 now SQ is stepping up to the plate. |
| Mactheriverrat 3,173 posts msg #141219 - Ignore Mactheriverrat |
1/21/2018 12:27:28 AM Lets look at MMA's 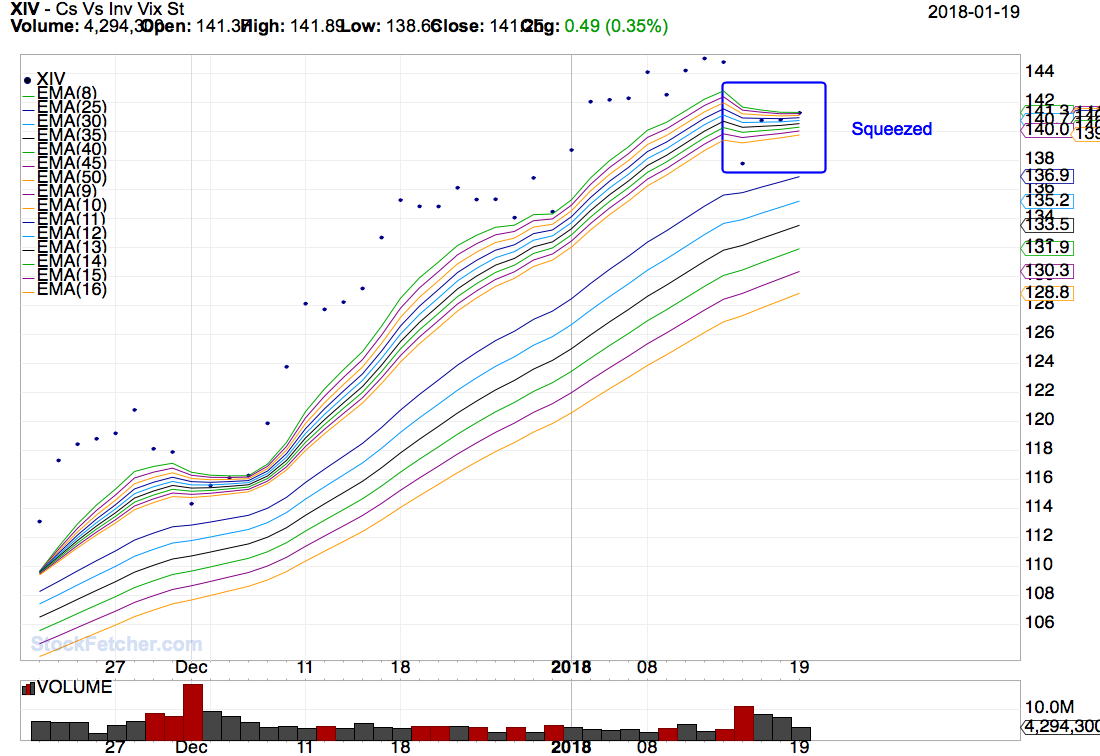 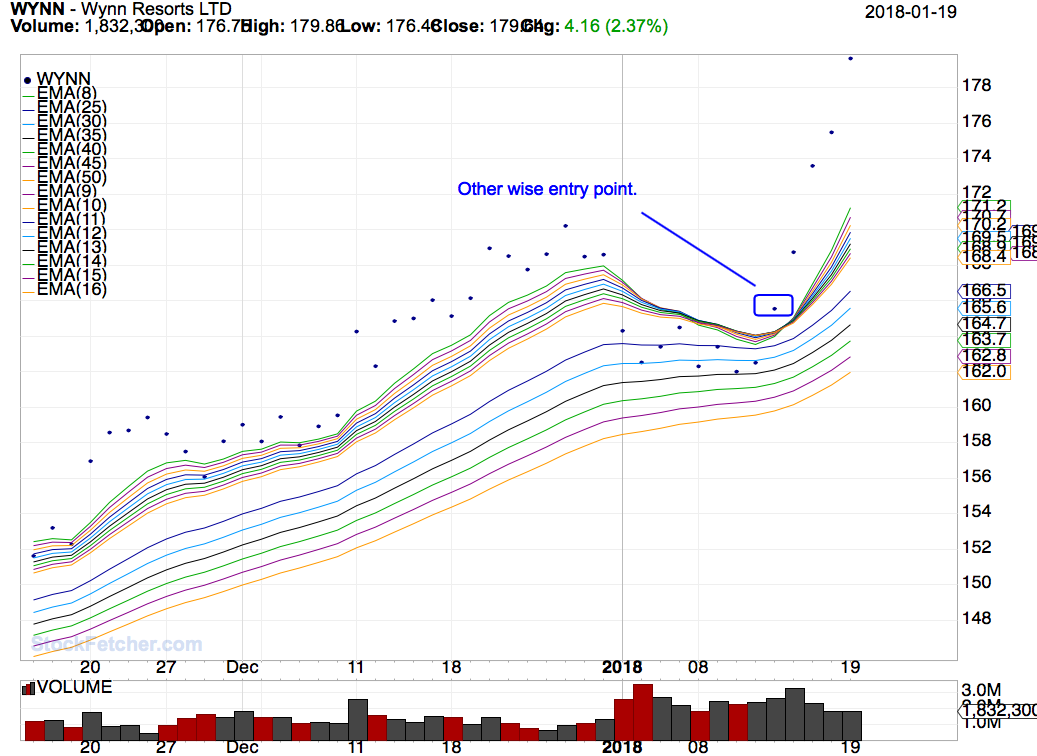 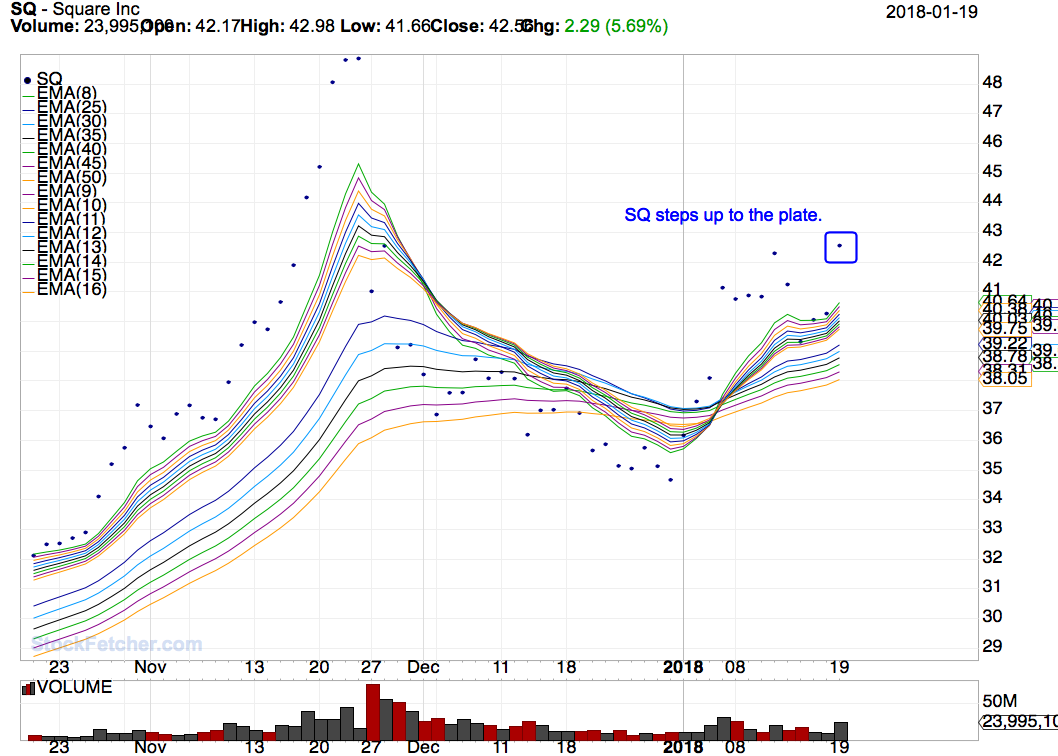 All bets are off monday as Markets could take a dump with this Government shut down and no progress of trying to get it running. Now with that being said XIV could take a nice dump. |
| shillllihs 6,101 posts msg #141305 - Ignore shillllihs |
1/23/2018 11:32:03 PM So now all 3 GUSH short bars have now turned long. Not sure what to make of this indicator at this point. |
| Mactheriverrat 3,173 posts msg #141335 - Ignore Mactheriverrat modified |
1/24/2018 4:18:47 PM I'm beginning to think that this DMA cross is a pre precursor to a move. After drifting the last couple of days it posted a long position today. Guess to see what happens the next couple of days. 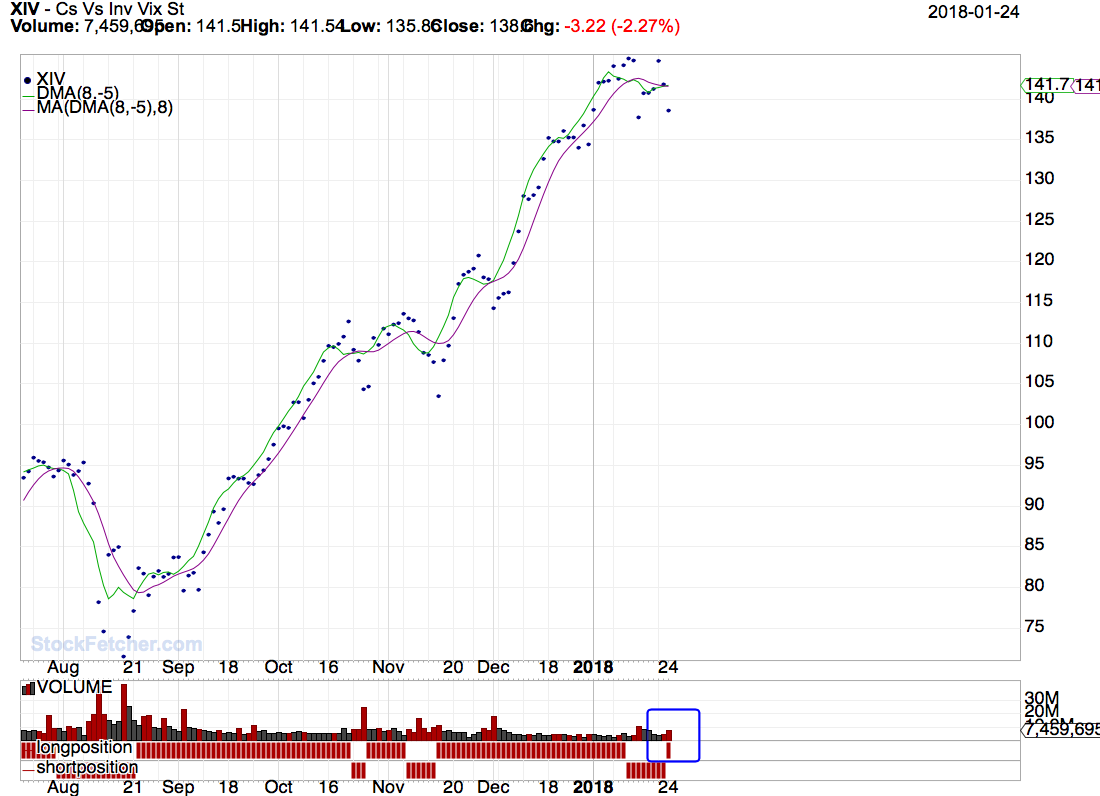 |
| pthomas215 1,251 posts msg #141344 - Ignore pthomas215 |
1/24/2018 9:46:11 PM Mac, so should you wait for 3 'buy' red bars before entering in your model? seems like you are right. |
| Mactheriverrat 3,173 posts msg #141350 - Ignore Mactheriverrat modified |
1/24/2018 11:37:12 PM I'm think your right PThomas WYNN had a cross over and it has done great! 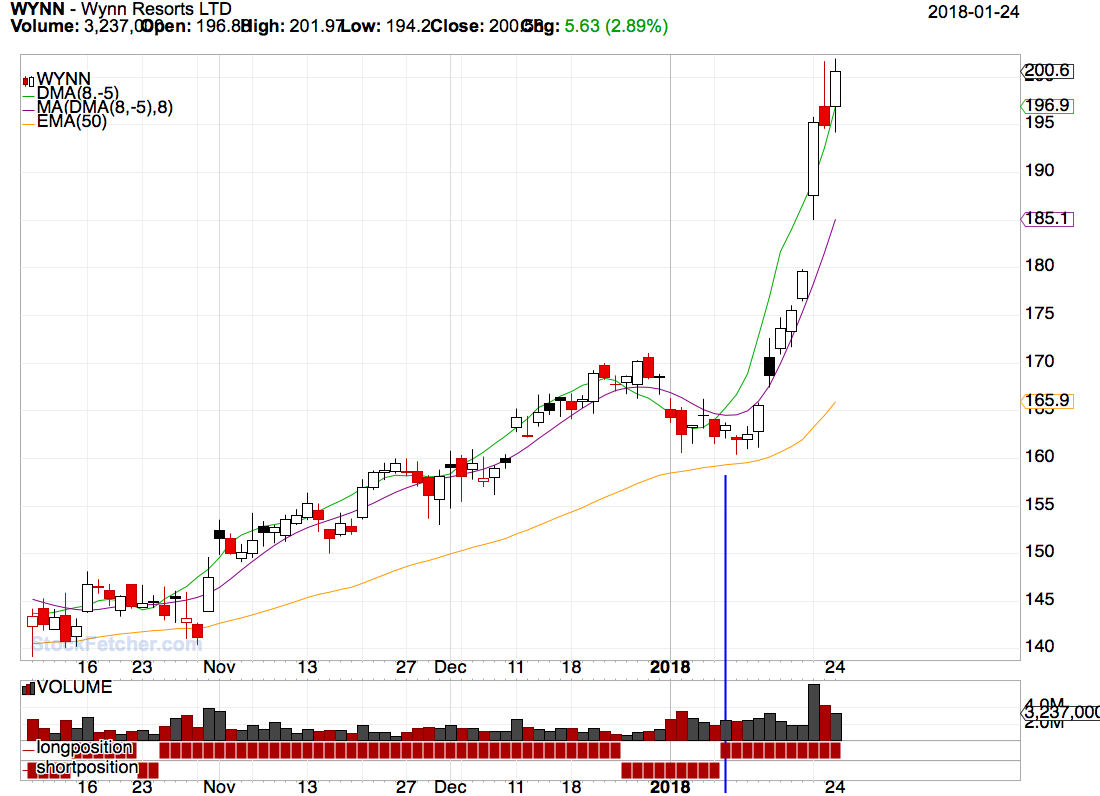 |
| shillllihs 6,101 posts msg #141352 - Ignore shillllihs |
1/25/2018 2:42:01 AM I thought 3 days too and may be true, but there will still be no way to tell if it’s a reversal or an eminent 1 day whipsaw in the middle of it all. These will be hard to decipher. Only time will tell. |
| davesaint86 726 posts msg #141353 - Ignore davesaint86 |
1/25/2018 8:24:00 AM Impressive on Wynn! |
| davesaint86 726 posts msg #141354 - Ignore davesaint86 |
1/25/2018 8:31:18 AM I purchased dfen a few days ago. I'm sitting on a small gain. The DMA8 sell triggered yesterday. Pre-market dfen is up. This one is going sideways and can go either way. |
| StockFetcher Forums · General Discussion · XIV | << 1 ... 9 10 11 12 13 ... 22 >>Post Follow-up |