StockFetcher Forums · General Discussion · XIV<< 1 ... 14 15 16 17 18 ... 22 >>Post Follow-up
davesaint86
726 posts
msg #141814
Ignore davesaint86
2/3/2018 7:16:01 PM

I modified one of Kevin's Sharpe Allocation filters and embedded the code into my DMA8 filter. I do not know if it buys me anything. My goal is to find something that can get you in and out of a position faster when a trend changes abruptly. You can add whatever Bull/Inverse pair that you like to it (UGAZ/DGAZ, LABU/LABD, ZIV/VXZ, TMF/TMV, etc). I'm just playing around since I couldn't go skiing today.

Fetcher[
SYMLIST(xiv,vxx,shy)

SET{perf1A, ma(3) 6 days ago}
SET{perf1b, MA(3) / perf1a}
SET{perf, perf1b - 1}
SET{var1, perf*100}
SET{rfr, ind(^irx,close)}
SET{RISKFREERETURN, rfr/100}
SET{perf6, perf - RISKFREERETURN}
SET{STD6, CSTDDEV(CLOSE,6)}
SET{VOL6a, STD6 / MA(6)}
SET{vol6, vol6a * 100}

/*CALCULATION OF SHARPE RATIO - ANNUALIZED*/
SET{SHARPE1a, perf6 / VOL6a}
set{sharpe, sharpe1a * 0.5}

set{var1a, IND(xiv, var1)}
set{var1b, IND(vxx, var1)}
set{var1c, IND(shy, var1)}


SET{RANK1A, COUNT(var1 is above var1a,1)}
SET{RANK1B, COUNT(var1 is above var1b,1)}
SET{RANK1C, COUNT(var1 is above var1c,1)}


SET{RANK1D, RANK1A + RANK1B}
SET{RANK1E, RANK1C + RANK1D}

SET{RANK, 3 - RANK1E}


set{var2a, IND(xiv, sharpe)}
set{var2b, IND(vxx, sharpe)}
set{var2c, IND(shy, sharpe)}


SET{var3a, COUNT(var2a is above 0,1)}
SET{var3b, COUNT(var2b is above 0,1)}
SET{var3c, COUNT(var2c is above 0,1)}


SET{var4a, var2A * var3a}
SET{var4b, var2b * var3b}
SET{var4c, var2c * var3c}


set{var5a, var4a + var4b}
set{var5b, var4c}
set{var5c, var5a + var5b}


SET{allocation1, sharpe / var5c}


set{allocation2, allocation1 * count(sharpe above 0,1)}
set{allocation, allocation2 *100}

draw ema(25)
draw ema(30)
draw ema(35)
draw ema(40)
draw ema(45)
draw ema(50)
and draw Slow Stochastic(14,3) Fast %K line at 20.00 and draw Slow Stochastic(14,3) Fast %K line at 80.00
and draw Slow Stochastic(14,3) Fast %K line at 50.00
and draw Slow Stochastic(5,1) Fast %K line at 20.00 and draw Slow Stochastic(5,1) Fast %K line at 80.00 and draw Slow Stochastic(5,1) Fast %K line at 50.00
draw macd(8,17,5)
set{E4, TSI(5,5,9) - Smoothed TSI(5,5,9)}
set{TDLongposition, count(E4 > 0,1)}
set{TDShortposition, count(E4 < 0,1)}
SET{TDTRIGGER,0}

/* AxA is number of consecutive days cma(DMA(8,-5),8) above (+)/below(-) previous cma(DMA(8,-5),8) */
set{AAb,days( cma(DMA(8,-5),8) is above cma(DMA(8,-5),8) 1 day ago,250)}
set{AAa,days( cma(DMA(8,-5),8) is below cma(DMA(8,-5),8) 1 day ago,250)}
set{dmax8, AAa - AAb}
and add column dmax8 {dma_x_8}
do not Draw AxA
Set{cntcmadma8abovecmadma8,count( cma(DMA(8,-5),8) > cma(DMA(8,-5),8) 1day ago,1)}
draw cntcmadma8abovecmadma8
Set{cntcmadma8abovecmadma8b,count( cma(DMA(8,-5),8)< cma(DMA(8,-5),8) 1day ago,1)}
draw cntcmadma8abovecmadma8b
draw cntema13aboveema13b
set{E3,dma(8,-5),8)-cma(DMA(8,-5),8) }
set{Longposition, count(E3 > 0,1)}
set{Shortposition, count(E3 < 0,1)}
draw Longposition on plot
draw Shortposition on plot
draw dma(8,-5),8)
draw cma(DMA(8,-5),8)

set{E9, close above ma(18)}
set{DLongposition, count(E9 > 0,1)}
set{DShortposition, count(E9 < 0,1)}
SET{DTRIGGER,0}

set{CRS1, rsi(4),1)}
set{CRS2, rsi(9),1)}
set{CRS3, rsi(30),1)}
set{CCRS1, CRS1 + CRS2}
set{CCRS2, CCRS1 + CRS3}
set{CCRS3, CCRS2 /3}


set{CRS4, weekly rsi(4),1)}
set{CRS5, weekly rsi(9),1)}
set{CRS6, weekly rsi(30),1)}

set{WCRS1, CRS4 + CRS5}
set{WCRS2, WCRS1 + CRS6}
set{WCRS3, WCRS2 /3}
set{CWRSI1, CCRS3 + WCRS3}
set{C-RSI, CWRSI1 /2}
set{RSI30, RSI(30) - 50}
set{CRSI_Bar, RSI30}
draw CRSI_Bar
PlotType{CRSI_Bar,zerobar}
set{RSI9, RSI(9) - 50}
set{RSI9_line, RSI9}
draw RSI9 on plot CRSI_Bar
set{RSI4, RSI(4) - 50}
set{RSI4_line, RSI4}
draw RSI4 on plot CRSI_Bar
set{drsilong1, count(rsi(30) above 5, 1)}
set{drsilong2, count(rsi(4) above rsi(30), 1)}
set{drsilong3, count(rsi(9) above rsi(30), 1)}
set{drsilong4, drsilong1 + drsilong2}
set{drsilong5, drsilong4 + drsilong3}
set{drsilong, count(drsilong5 equals 3, 1)}
set{drsishort, count(drsilong5 less than 3, 1)}
SET{DRSITRIGGER,0}
draw drsilong on plot
draw drsishort on plot

set{wrsi1, weekly rsi(4)}
set{wrsi2, weekly rsi(30)}
set{wrsi3, count(wrsi1 > wrsi2,1)}
set{wrsilong, count(wrsi3 equals 1, 1)}
set{wrsishort, count(wrsi3 less than 1, 1)}

set{CRS21, ROC(21,1)}
set{CRS63, ROC(63,1)}
set{CRS126, ROC(126,1)}
set{CR1, CRS21 + CRS63}
set{C-RS, CR1 + CRS126}

set{wsto, weekly Slow Stochastics(14,3)}
set{dsto, Slow Stochastics(14,3)}
set{wdsto, wsto + dsto}
set{CSTO, wdsto / 2}

set{TWRSI4, weekly RSI(4)}
set{TWRSI9, weekly RSI(9)}
set{TWRSI30, weekly RSI(30)}
set{TWRSI1, TWRSI4 + TWRSI9}
set{TWRSI2, TWRSI1 + TWRSI30}
set{A-WRSI, TWRSI2 / 3}

set{TDRSI4, RSI(4)}
set{TDRSI9, RSI(9)}
set{TDRSI30, RSI(30)}
set{TDRSI1, TDRSI4 + TDRSI9}
set{TDRSI2, TDRSI1 + TDRSI30}
set{A-DRSI, TDRSI2 / 3}
set{E10, close above Upper Bollinger Bands(18,2)}
set{BBLongposition, count(E10 > 0,1)}
set{BBShortposition, count(E10 < 0,1)}
SET{BBTRIGGER,0}

ADD COLUMN SEPARATOR
add column BBLongposition{BBSell}
ADD COLUMN SEPARATOR
ADD COLUMN RANK {Rank}
ADD COLUMN SEPARATOR
add column Sharpe Ratio(6) {Sharpe}
add column separator
add column allocation {Alloc %}
add column separator
add column Longposition {DMA8}
add column separator
add column drsilong {drsi}
add column separator
add column TDLongposition {DTSI}
add column separator
add column wrsilong {WRSI}
add column separator
ADD COLUMN ROC(126,1) {6 mth %}
add column separator
ADD COLUMN ROC(63,1) {3 mth %}
add column separator
ADD COLUMN ROC(21,1) {1 mth %}
add column separator
add column C-RS
add column separator
add column Upper Bollinger Bands(18.2) {Up-BB}
add column separator
add column lower Bollinger Bands(18.2) {Low-BB}
ADD COLUMN SEPARATOR
add column weekly Slow Stochastics(14,3){wSto}
ADD COLUMN SEPARATOR
add column Slow Stochastics(14,3){dSto}
ADD COLUMN SEPARATOR
add column csto
ADD COLUMN SEPARATOR
add column A-WRSI
ADD COLUMN SEPARATOR
add column A-DRSI
ADD COLUMN SEPARATOR
add column c-rsi
ADD COLUMN SEPARATOR
add column IFT(4,1) {dift}
add column separator
add column weekly IFT(4,1) {wift}
add column separator

add column rsi(4){drsi4}
add column separator
add column rsi(9){drsi9}
add column separator
add column rsi(30){drsi30}
add column separator
add column RSI(2)
add column separator
add column atr(21) {Atr}
add column separator
add column average day range (21){ADR%}

SORT COLUMN 9 ASCENDING
chart-time is 75 days
]


davesaint86
726 posts
msg #141815
Ignore davesaint86
2/3/2018 7:20:02 PM

Hedge 4-ETF Version

Fetcher[
apply to symlist(eev,ugld,vxx,tmf)
SET{perf1A, ma(3) 6 days ago}
SET{perf1b, MA(3) / perf1a}
SET{perf, perf1b - 1}
SET{var1, perf*100}
SET{rfr, ind(^irx,close)}
SET{RISKFREERETURN, rfr/100}
SET{perf6, perf - RISKFREERETURN}
SET{STD6, CSTDDEV(CLOSE,6)}
SET{VOL6a, STD6 / MA(6)}
SET{vol6, vol6a * 100}

/*CALCULATION OF SHARPE RATIO - ANNUALIZED*/
SET{SHARPE1a, perf6 / VOL6a}
set{sharpe, sharpe1a * 0.5}

set{var1a, IND(eev, var1)}
set{var1b, IND(ugld, var1)}
set{var1c, IND(vxx, var1)}
set{var1d, IND(tmf, var1)}

SET{RANK1A, COUNT(var1 is above var1a,1)}
SET{RANK1B, COUNT(var1 is above var1b,1)}
SET{RANK1C, COUNT(var1 is above var1c,1)}
SET{RANK1D, COUNT(var1 is above var1d,1)}
SET{RANK1E, RANK1A + RANK1B}
SET{RANK1F, RANK1C + RANK1D}
SET{RANK1G, RANK1E + RANK1F}
SET{RANK, 4 - RANK1G}

set{var2a, IND(eev, sharpe)}
set{var2b, IND(ugld, sharpe)}
set{var2c, IND(vxx, sharpe)}
set{var2d, IND(tmf, sharpe)}

SET{var3a, COUNT(var2a is above 0,1)}
SET{var3b, COUNT(var2b is above 0,1)}
SET{var3c, COUNT(var2c is above 0,1)}
SET{var3d, COUNT(var2d is above 0,1)}

SET{var4a, var2A * var3a}
SET{var4b, var2b * var3b}
SET{var4c, var2c * var3c}
SET{var4d, var2d * var3d}

set{var5a, var4a + var4b}
set{var5b, var4c + var4d}
set{var5c, var5a + var5b}

SET{allocation1, sharpe / var5c}
set{allocation2, allocation1 * count(sharpe above 0,1)}
set{allocation, allocation2 *100}

draw ema(25)
draw ema(30)
draw ema(35)
draw ema(40)
draw ema(45)
draw ema(50)
and draw Slow Stochastic(14,3) Fast %K line at 20.00 and draw Slow Stochastic(14,3) Fast %K line at 80.00
and draw Slow Stochastic(14,3) Fast %K line at 50.00
and draw Slow Stochastic(5,1) Fast %K line at 20.00 and draw Slow Stochastic(5,1) Fast %K line at 80.00 and draw Slow Stochastic(5,1) Fast %K line at 50.00
draw macd(8,17,5)
set{E4, TSI(5,5,9) - Smoothed TSI(5,5,9)}
set{TDLongposition, count(E4 > 0,1)}
set{TDShortposition, count(E4 < 0,1)}
SET{TDTRIGGER,0}

/* AxA is number of consecutive days cma(DMA(8,-5),8) above (+)/below(-) previous cma(DMA(8,-5),8) */
set{AAb,days( cma(DMA(8,-5),8) is above cma(DMA(8,-5),8) 1 day ago,250)}
set{AAa,days( cma(DMA(8,-5),8) is below cma(DMA(8,-5),8) 1 day ago,250)}
set{dmax8, AAa - AAb}
and add column dmax8 {dma_x_8}
do not Draw AxA
Set{cntcmadma8abovecmadma8,count( cma(DMA(8,-5),8) > cma(DMA(8,-5),8) 1day ago,1)}
draw cntcmadma8abovecmadma8
Set{cntcmadma8abovecmadma8b,count( cma(DMA(8,-5),8)< cma(DMA(8,-5),8) 1day ago,1)}
draw cntcmadma8abovecmadma8b
draw cntema13aboveema13b
set{E3,dma(8,-5),8)-cma(DMA(8,-5),8) }
set{Longposition, count(E3 > 0,1)}
set{Shortposition, count(E3 < 0,1)}
draw Longposition on plot
draw Shortposition on plot
draw dma(8,-5),8)
draw cma(DMA(8,-5),8)

set{E9, close above ma(18)}
set{DLongposition, count(E9 > 0,1)}
set{DShortposition, count(E9 < 0,1)}
SET{DTRIGGER,0}

set{CRS1, rsi(4),1)}
set{CRS2, rsi(9),1)}
set{CRS3, rsi(30),1)}
set{CCRS1, CRS1 + CRS2}
set{CCRS2, CCRS1 + CRS3}
set{CCRS3, CCRS2 /3}


set{CRS4, weekly rsi(4),1)}
set{CRS5, weekly rsi(9),1)}
set{CRS6, weekly rsi(30),1)}

set{WCRS1, CRS4 + CRS5}
set{WCRS2, WCRS1 + CRS6}
set{WCRS3, WCRS2 /3}
set{CWRSI1, CCRS3 + WCRS3}
set{C-RSI, CWRSI1 /2}
set{RSI30, RSI(30) - 50}
set{CRSI_Bar, RSI30}
draw CRSI_Bar
PlotType{CRSI_Bar,zerobar}
set{RSI9, RSI(9) - 50}
set{RSI9_line, RSI9}
draw RSI9 on plot CRSI_Bar
set{RSI4, RSI(4) - 50}
set{RSI4_line, RSI4}
draw RSI4 on plot CRSI_Bar
set{drsilong1, count(rsi(30) above 5, 1)}
set{drsilong2, count(rsi(4) above rsi(30), 1)}
set{drsilong3, count(rsi(9) above rsi(30), 1)}
set{drsilong4, drsilong1 + drsilong2}
set{drsilong5, drsilong4 + drsilong3}
set{drsilong, count(drsilong5 equals 3, 1)}
set{drsishort, count(drsilong5 less than 3, 1)}
SET{DRSITRIGGER,0}
draw drsilong on plot
draw drsishort on plot

set{wrsi1, weekly rsi(4)}
set{wrsi2, weekly rsi(30)}
set{wrsi3, count(wrsi1 > wrsi2,1)}
set{wrsilong, count(wrsi3 equals 1, 1)}
set{wrsishort, count(wrsi3 less than 1, 1)}

set{CRS21, ROC(21,1)}
set{CRS63, ROC(63,1)}
set{CRS126, ROC(126,1)}
set{CR1, CRS21 + CRS63}
set{C-RS, CR1 + CRS126}

set{wsto, weekly Slow Stochastics(14,3)}
set{dsto, Slow Stochastics(14,3)}
set{wdsto, wsto + dsto}
set{CSTO, wdsto / 2}

set{TWRSI4, weekly RSI(4)}
set{TWRSI9, weekly RSI(9)}
set{TWRSI30, weekly RSI(30)}
set{TWRSI1, TWRSI4 + TWRSI9}
set{TWRSI2, TWRSI1 + TWRSI30}
set{A-WRSI, TWRSI2 / 3}

set{TDRSI4, RSI(4)}
set{TDRSI9, RSI(9)}
set{TDRSI30, RSI(30)}
set{TDRSI1, TDRSI4 + TDRSI9}
set{TDRSI2, TDRSI1 + TDRSI30}
set{A-DRSI, TDRSI2 / 3}
set{E10, close above Upper Bollinger Bands(18,2)}
set{BBLongposition, count(E10 > 0,1)}
set{BBShortposition, count(E10 < 0,1)}
SET{BBTRIGGER,0}

ADD COLUMN SEPARATOR
add column BBLongposition{BBSell}
ADD COLUMN SEPARATOR
ADD COLUMN RANK {Rank}
ADD COLUMN SEPARATOR
add column Sharpe Ratio(6) {Sharpe}
add column separator
add column allocation {Alloc %}
add column separator
add column Longposition {DMA8}
add column separator
add column drsilong {drsi}
add column separator
add column TDLongposition{DTSI}


add column separator
add column wrsilong {WRSI}
add column separator
ADD COLUMN ROC(126,1) {6 mth %}
add column separator
ADD COLUMN ROC(63,1) {3 mth %}
add column separator
ADD COLUMN ROC(21,1) {1 mth %}
add column separator
add column C-RS
add column separator
add column Upper Bollinger Bands(18.2) {Up-BB}
add column separator
add column lower Bollinger Bands(18.2) {Low-BB}
ADD COLUMN SEPARATOR
add column weekly Slow Stochastics(14,3){wSto}
ADD COLUMN SEPARATOR
add column Slow Stochastics(14,3){dSto}
ADD COLUMN SEPARATOR
add column csto
ADD COLUMN SEPARATOR
add column A-WRSI
ADD COLUMN SEPARATOR
add column A-DRSI
ADD COLUMN SEPARATOR
add column c-rsi
ADD COLUMN SEPARATOR
add column IFT(4,1) {dift}
add column separator
add column weekly IFT(4,1) {wift}
add column separator

add column rsi(4){drsi4}
add column separator
add column rsi(9){drsi9}
add column separator
add column rsi(30){drsi30}
add column separator
add column RSI(2)
add column separator
add column atr(21) {Atr}
add column separator
add column average day range (21){ADR%}

SORT COLUMN 9 ASCENDING
chart-time is 75 days
]


pthomas215
1,251 posts
msg #141816
Ignore pthomas215
2/3/2018 7:47:56 PM

mac, it may stop at 105 but there is an additional support like if you go back to August...topped @ 97, then went back down to that exact level later. Just saying we may see an up day Monday but it would not surprise me if next week we dropped below 100 to 97

davesaint86
726 posts
msg #141822
Ignore davesaint86
2/3/2018 9:16:49 PM

Mac - Just noticed that you changed the code a little. Cool!

Mactheriverrat
3,178 posts
msg #141826
Ignore Mactheriverrat
2/4/2018 1:02:51 AM

@PT -Support levels are always good to watch.

@Dave Roger that on the changed code

cma(DMA(8,-5),1) cross above cma(DMA(8,-5),8)

I've added
do not draw dma(8,-5),8) but still keep watching it

It seems that the cma(DMA(8,-5),1) and cma(DMA(8,-5),8) are a little slower and so far seem to be working well with each other.

I just got out of WFC 2 days ago in my IRA on a cma(DMA(8,-5),1) cross below cma(DMA(8,-5),8)
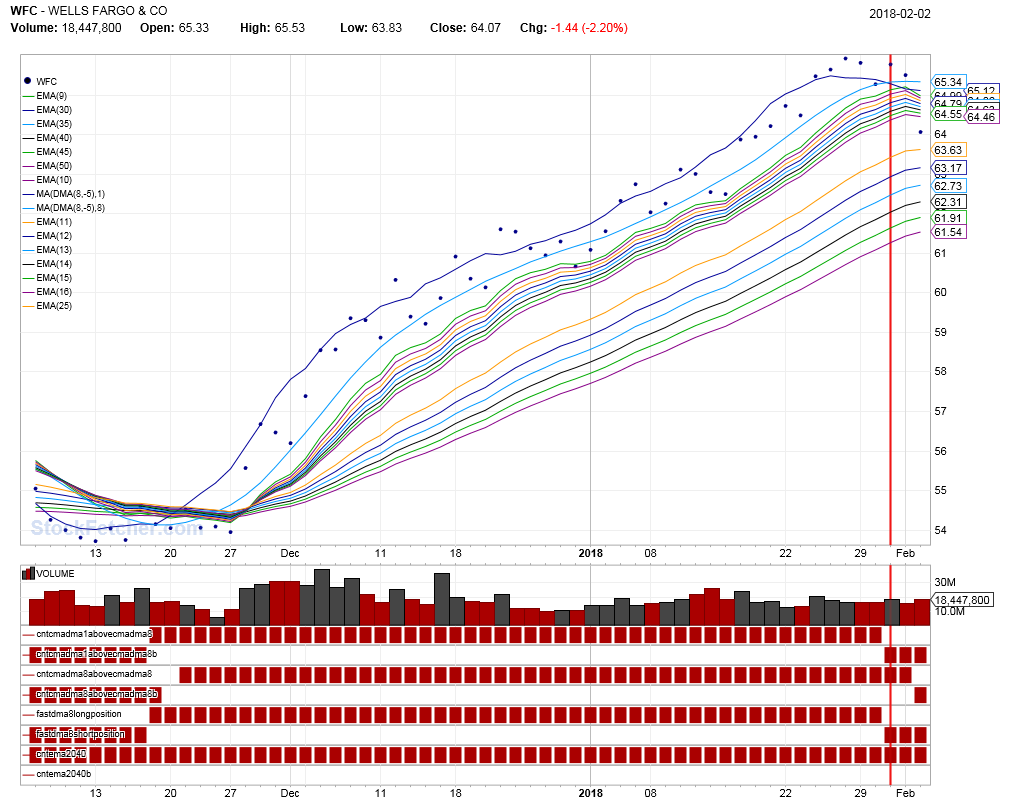


pthomas215
1,251 posts
msg #141832
Ignore pthomas215
2/4/2018 11:20:04 AM

Mac/Davesaint, what is your favorite cma dma filter then that includes ""cma(DMA(8,-5),1) crossed above cma(DMA(8,-5),8)" ?

Cheese
1,374 posts
msg #141833
Ignore Cheese
2/4/2018 12:08:11 PM

Thank you, Mac and Dave, for sharing your very helpful filters.

I have a request along the line of pthomas.
May I suggest that you start a new read-only repository thread to help readers better follow your many excellent filters? e.g.
MACTHERIVERRAT REPOSITORY (read-only)
DAVESAINT86 REPOSITORY (read-only)
Perhaps, you could also add dates to your comments inside the filters so readers can follow a little easier.

Again, many thanks to both of you.

pthomas215
1,251 posts
msg #141834
Ignore pthomas215
2/4/2018 12:40:05 PM

cheese, what a great suggestion. the reason is a lot of this is learning as we go, so at times it helps to have something in an organized format.

different subject but same concept. I respectfully think Kevin's system is insufficient. if you opened a buy signal during the run, and then XIV suffers more than a 20% drop in value, which it did--and you dont see a corresponding sell signal with the buy signals you opened during the run up---then the system is no better than ""it is a bull market so buy more on the dip". this mentality could clear out an account if valuations drop significantly. I think Kevin's system needs to be refined to include more sell signals when xiv prices drop. Not trying to be critical--just an observation that more work on the system needs to be done.

Mactheriverrat
3,178 posts
msg #141836
Ignore Mactheriverrat
2/4/2018 12:55:24 PM

@pt
Just put this trigger code in any filter. I myself the less indicators the better- they are just noise and make people have Analysis paralysis. Its not the Holy Grail but so far its better trigger than anything that I can come up with. There 's will be flaws where its just doesn't pan out- One can make a symlist of past winners and study what if.
-------------------------------------------------------------------------------------


Set{cntcmadma1abovecmadma8,count( cma(DMA(8,-5),1) > cma(DMA(8,-5),8) ,1)}
draw cntcmadma1abovecmadma8

Set{cntcmadma1abovecmadma8b,count( cma(DMA(8,-5),1)< cma(DMA(8,-5),8) ,1)}

draw cntcmadma1abovecmadma8b

/* AxA is number of consecutive days cma(DMA(8,-5),1) above (+)/below(-) previous cma(DMA(8,-5),8) */
set{AAb,days( cma(DMA(8,-5),1) is above cma(DMA(8,-5),8) ,250)}
set{AAa,days( cma(DMA(8,-5),1) is below cma(DMA(8,-5),8) ,250)}
set{dmax8, AAa - AAb} and add column dmax8 {dma_x_1over8}
do not Draw AxA

do not draw dma(8,-5),8)

draw cma(DMA(8,-5),1)
draw cma(DMA(8,-5),8)
---------------------------------------------------------------------------------------------------
@ Cheese Good idea !

davesaint86
726 posts
msg #141837
Ignore davesaint86
modified
2/4/2018 12:55:45 PM

pthomas - I assume when you reference the Kevin systems you are talking about the StrataSearch system signals. Time will tell really soon (or maybe it already has) if StrataSearch needs to be optimized or it sees positive divergences forming. I do not have the answer. The filter Mac posted and other indicators/strategies would have got you out with minimal damage. Even IRA Epstein states sell at the Bollinger Band and wait for price to come back down to the MA(18) and when it turns back up buy again.

Just looking back at the previous downturns of XIV it looks like XIV recovers fast. However, I agree with you why take the downturn hit if you do not have to.

StockFetcher Forums · General Discussion · XIV<< 1 ... 14 15 16 17 18 ... 22 >>Post Follow-up

*** Disclaimer *** StockFetcher.com does not endorse or suggest any of the securities which are returned in any of the searches or filters. They are provided purely for informational and research purposes. StockFetcher.com does not recommend particular securities. StockFetcher.com, Vestyl Software, L.L.C. and involved content providers shall not be liable for any errors or delays in the content, or for any actions taken based on the content.


Copyright 2026 - Vestyl Software L.L.C.Terms of Service | License | Questions or comments? Contact Us
EOD Data sources: DDFPlus & CSI Data Quotes delayed during active market hours. Delay times are at least 15 mins for NASDAQ, 20 mins for NYSE and Amex. Delayed intraday data provided by DDFPlus


This site is protected by reCAPTCHA and the Google Privacy Policy and Terms of Service apply.