| StockFetcher Forums · General Discussion · XIV | << 1 ... 18 19 20 21 22 >>Post Follow-up |
| dtatu 143 posts msg #141975 - Ignore dtatu |
2/6/2018 7:07:49 PM https://www.barchart.com/etfs-funds/quotes/XIV/technical-chart?plot=CANDLE&volume=total&data=DO&density=M&pricesOn=0&asPctChange=0&logscale=0&indicators=MACD(12,26,9);STOSL(5,3);TREND;SMA(10);SMA(100);EXPMA(10);EXPMA(100)&sym=XIV&grid=1&height=500&studyheight=100 I usually use daily SAR filter to get out 1/3 to 1/2 of my position; the other half I exit on the weekly SAR - I might filter it with thr TREND SPOTTER ( above), which is less tight than SAR. Actually , anybody has the SF " Trend spotter" code? |
| Mactheriverrat 3,178 posts msg #141976 - Ignore Mactheriverrat modified |
2/6/2018 7:11:01 PM @PT No I wasn't thinking that at all- I was just saying the the short term get out signs were there . It would have save anyone anywhere the pain of the see who could get out the fastest when XIV took a CRASH. @Karen Not right off hand but I will take a stab at it soon! |
| mahkoh 1,065 posts msg #142002 - Ignore mahkoh |
2/7/2018 2:28:54 PM In the rearview mirror it is a lot easier to see when you should have gotten out. Problem is that on previous occasions a big red candle below the longterm guppy lines proved to be an excellent opportunity to buy. |
| sandjco 648 posts msg #142007 - Ignore sandjco |
2/7/2018 7:00:51 PM this black swan event was bizarre leading to CS to terminate it. the spike was just plain weird. |
| four 5,087 posts msg #142017 - Ignore four |
2/8/2018 8:02:10 AM https://www.fool.com/investing/2018/02/06/the-simple-math-behind-the-inverse-volatility-etf.aspx |
| Mactheriverrat 3,178 posts msg #142081 - Ignore Mactheriverrat |
2/9/2018 1:14:10 PM This XIV is yesterdays news- |
| Mactheriverrat 3,178 posts msg #142123 - Ignore Mactheriverrat |
2/11/2018 3:24:08 PM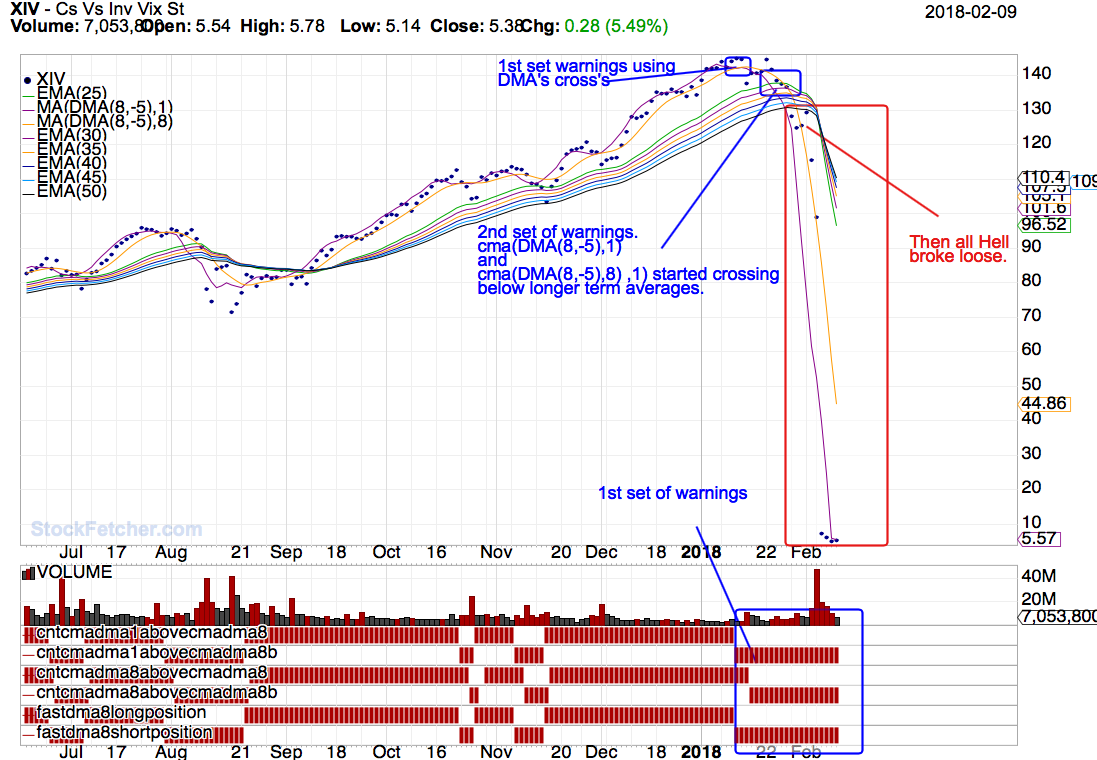 |
| shillllihs 6,102 posts msg #142125 - Ignore shillllihs |
2/11/2018 4:23:54 PM But doesn’t dma keep changing so is this an accurate assertion? |
| pthomas215 1,251 posts msg #142126 - Ignore pthomas215 |
2/11/2018 4:55:07 PM yes, i think it does, just like price crossing above the ema 13 sends price action up, but it can cross over down soon after and price action will follow. i think mac's point is one of long term averages...once price action falls below those averages, long term investors are giving up on it. if i mis spoke, I apologize to you Mac. I personally think not enough attention is paid to the Beta of a stock or ETF. I was in WATT this past week, up a buck. damn thing plummeted 1.50 in 2 minutes. i checked the Beta after....hmmm, makes sense now. a Beta over 1.5 is more profitable but more dangerous. |
| StockFetcher Forums · General Discussion · XIV | << 1 ... 18 19 20 21 22 >>Post Follow-up |