| StockFetcher Forums · General Discussion · XIV | << 1 ... 6 7 8 9 10 ... 22 >>Post Follow-up |
| davesaint86 726 posts msg #141119 - Ignore davesaint86 |
1/18/2018 7:25:25 AM The word of the day is "unisance" , lol. |
| davesaint86 726 posts msg #141124 - Ignore davesaint86 modified |
1/18/2018 9:32:38 AM Sandjco - I do not think this is exactly what you were looking for. You can add e3 crossed above 0 for buys and e3 crossed below 0 for sells. You can always use the bactest function (date offset) to look at the previous day buy or sells and keep a record that way. |
| davesaint86 726 posts msg #141125 - Ignore davesaint86 modified |
1/18/2018 9:36:04 AM I find it interesting now when I run this filter and add a date offset of three days and go to 1/12 there is no sell signal so maybe there is a SF bug. However, there is a sell signal on 1/16 which is correct. |
| novacane32000 331 posts msg #141153 - Ignore novacane32000 |
1/18/2018 8:55:14 PM Some new signals running this filter (1st one from Davesaint) at about 9pm EST 1/18/18 Short--GUSH ,LABU and TMV Long--LABD |
| shillllihs 6,102 posts msg #141155 - Ignore shillllihs |
1/18/2018 9:44:46 PM I went short Tmv based on my filter. So what did we deem these filters, real or fake news? |
| sandjco 648 posts msg #141159 - Ignore sandjco |
1/18/2018 11:19:51 PM Thanks Dave... appreciate you trying. Ill play with it. cheers. |
| Mactheriverrat 3,178 posts msg #141161 - Ignore Mactheriverrat |
1/19/2018 12:05:30 AM XIV still in Short position mode. 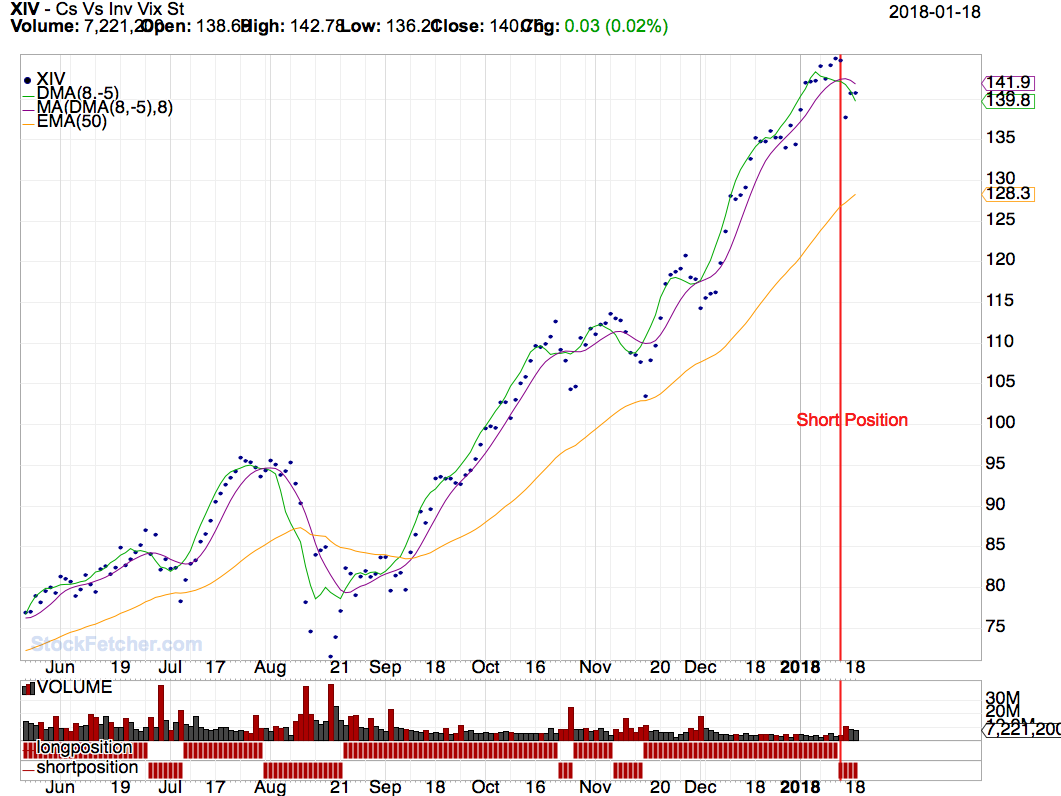 |
| davesaint86 726 posts msg #141181 - Ignore davesaint86 |
1/19/2018 5:30:45 PM Mach - What are the dots called? Makes it even clearer to read. |
| davesaint86 726 posts msg #141183 - Ignore davesaint86 |
1/19/2018 6:46:12 PM Novacane Some new signals running this filter (1st one from Davesaint) at about 9pm EST 1/18/18 Short--GUSH ,LABU and TMV Long--LABD I think it will be a lot easier to make money using the filter for whatever ETFs are the strongest. An etf in a 45 degree downturn may go on a three day run and make some money. I would rather be in the the ones in an upturn. With that said I'm closely following DGAZ which is in a downturn that looks like it might be strengthening. We might be able to make some money here. Maybe use the 2 hour live chart to get in and out if it turns against you. |
| Mactheriverrat 3,178 posts msg #141184 - Ignore Mactheriverrat |
1/19/2018 10:20:00 PM @dave I don't want you to think I'm being a smarta$$ but that's what they are on the chart are called dots. The do make charts better to read. IMHO. There are on the pop up menu top right corner. One can change chart price action to show candles, line, OHLC,Area or dot. XIV Still in shorting mode but dma(8,-5),8) takes a sharp turn up . 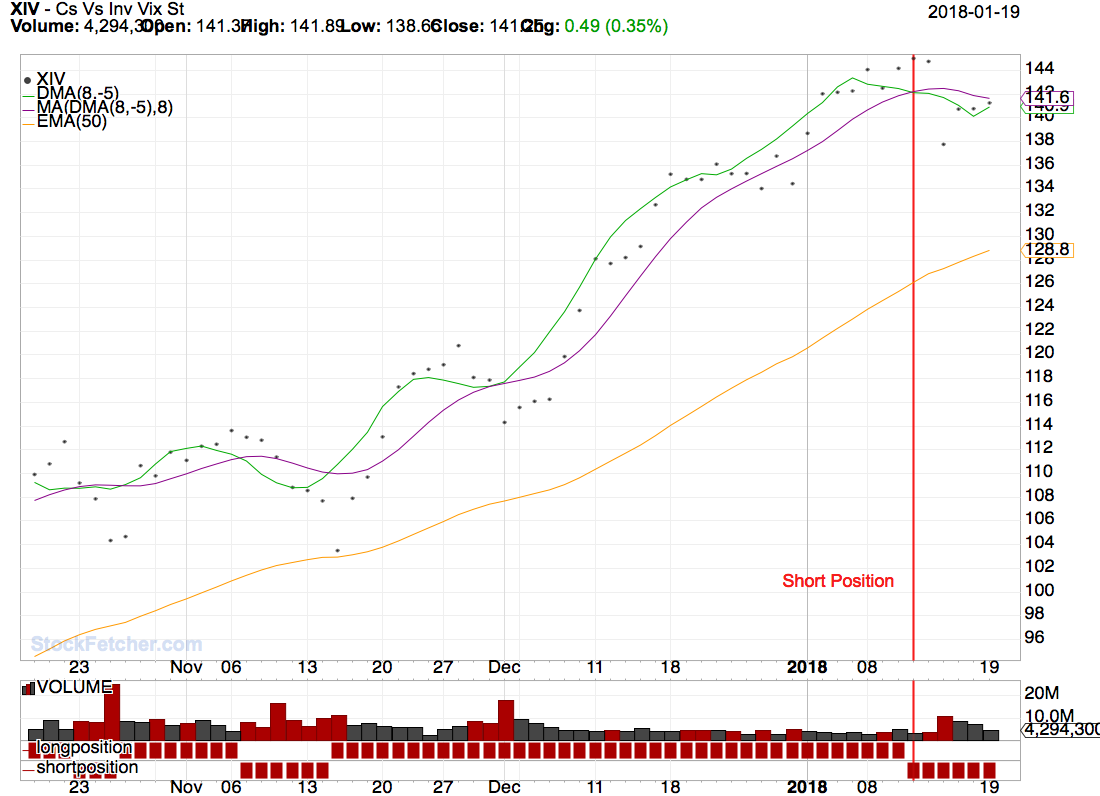 |
| StockFetcher Forums · General Discussion · XIV | << 1 ... 6 7 8 9 10 ... 22 >>Post Follow-up |