| StockFetcher Forums · General Discussion · XIV | << 1 ... 7 8 9 10 11 ... 22 >>Post Follow-up |
| Mactheriverrat 3,178 posts msg #141185 - Ignore Mactheriverrat modified |
1/19/2018 10:29:41 PM @Dave Thanks for posting that great code . I tend to agree as other's have posted in the past here on SF that there is no Holy Grail but its about near as I've seen . I'm still studying the Long positon short position crossover on past runners like JPM , BAC , AKS. All I can say is very interesting. Thanks again Dave. set{E3,dma(8,-5),8)-cma(DMA(8,-5),8) } set{Longposition, count(E3 > 0,1)} set{Shortposition, count(E3 < 0,1)} SET{TRIGGER,0} draw Longposition on plot draw Shortposition on plot draw dma(8,-5),8) draw cma(DMA(8,-5),8) |
| shillllihs 6,102 posts msg #141187 - Ignore shillllihs modified |
1/19/2018 11:53:25 PM Gush looks like the only one that held on to its short position, so I’m going to guess short GUsh to about 30. I’m thinking look for 2days in a row that don’t flip, and that’s your trend. |
| novacane32000 331 posts msg #141188 - Ignore novacane32000 |
1/20/2018 9:26:41 AM Yes , GUSH gave another short signal and LABD and LABU toggled and switched direction,which I'm ok with. Whipsaws will happen and are part of the game. The problem is ,the TMV short signal disappeared and now looks like it has been long for over a week which confirms it is impossible to backtest this filter accurately. Still like the filter very much to help identify a possible reversal in trend. |
| karennma 8,057 posts msg #141189 - Ignore karennma |
1/20/2018 9:29:35 AM @ Mac, (or anyone) Re: long x short column in Mac's filters "set{LONGxSHORT, LONGSHORTa - LONGSHORTb} and add column LONGxSHORT {LONG_x_SHORT}" What is that for? What does it mean? |
| karennma 8,057 posts msg #141190 - Ignore karennma |
1/20/2018 9:40:08 AM That's nice to see the color graph at the bottom, but I was trying to display it as columns so I wouldn't have to look at all the charts (i.e., if I have 50 results). Does anyone know how to fix this, please? set{longposition, count(E3 > 0,1)} set{shortposition, count(E3 < 0,1)} add column longposition add column shortposition That doesn't work. But I'm no coding expert, so .... WTH. TIA! |
| karennma 8,057 posts msg #141192 - Ignore karennma |
1/20/2018 9:47:56 AM Re: "/* LONGSHORT is number of consecutive days Longposition above (+)/below(-) previous Shortposition */ WHY is this important? |
| karennma 8,057 posts msg #141193 - Ignore karennma |
1/20/2018 10:04:10 AM Or better still, that vertical red line on the chart on msg #141184 ... If there were code to tell SF to draw that line when the trend flips .. WOW! That would be great. |
| Mactheriverrat 3,178 posts msg #141198 - Ignore Mactheriverrat modified |
1/20/2018 3:52:21 PM The red vertical line can be used in the pop up chart . Just change the color. Long and short is suggested when the dma(8,-5),8) and the cma(DMA(8,-5),8) intersect or make a crossover. Submit Submit Not trying to muddle this thread but I picked up WYNN using this code . over 10% gain in a week. Now like I posted before that there is NO Holy Grail but its not bad trigger I would say. 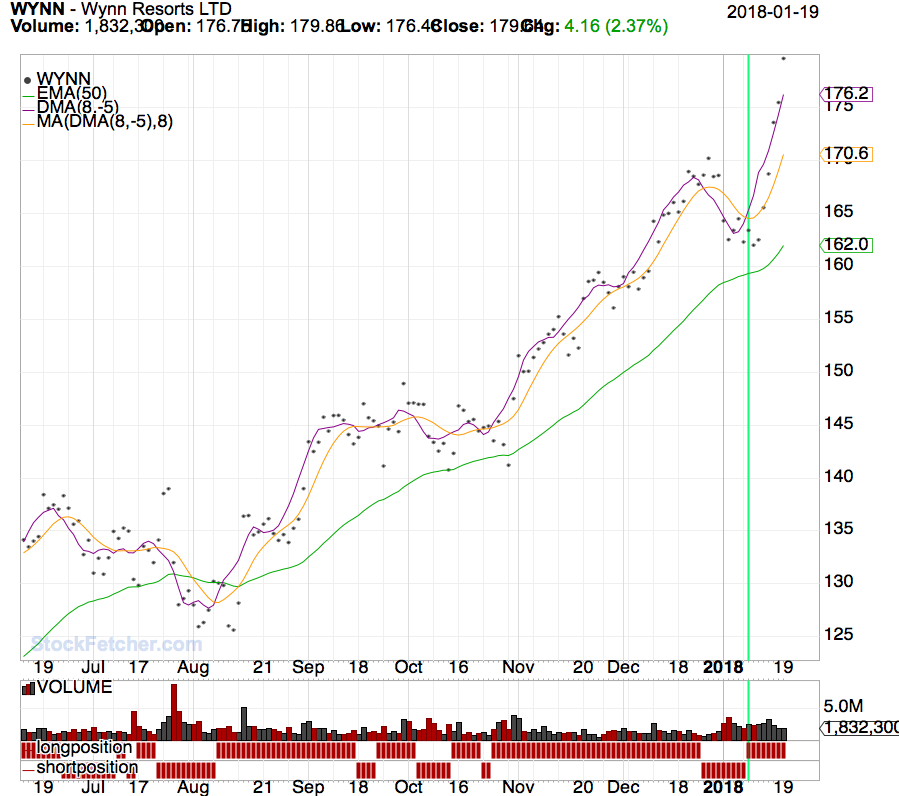 |
| karennma 8,057 posts msg #141202 - Ignore karennma |
1/20/2018 4:45:05 PM Mactheriverrat 1,363 posts msg #141198 - Ignore Mactheriverrat modified 1/20/2018 3:52:21 PM The red vertical line can be used in the pop up chart . Just change the color. Long and short is suggested when the dma(8,-5),8) and the cma(DMA(8,-5),8) intersect or make a crossover. ===================================== Red, green, blue ... whatever ... it's not automatic ... correct? I mean in the code, it doesn't say "draw this vertical line when the trend flips from ___ to __. BTW, HOW do you change the color? Is there code for that too? |
| karennma 8,057 posts msg #141203 - Ignore karennma |
1/20/2018 4:49:29 PM ** REPOSTING ** karennma 6,868 posts msg #141190 - Edit message 1/20/2018 9:40:08 AM That's nice to see the color graph at the bottom, but additionally, I was trying to display it as columns so I wouldn't have to look at all the charts (i.e., if I have 50 results). Does anyone know how to fix this, please? set{longposition, count(E3 > 0,1)} set{shortposition, count(E3 < 0,1)} add column longposition add column shortposition That doesn't work. But I'm no coding expert, so .... WTH. TIA! |
| StockFetcher Forums · General Discussion · XIV | << 1 ... 7 8 9 10 11 ... 22 >>Post Follow-up |